BTW, have you considered using time command to measure code change impact?
2 Likes
No, not exactly. Starship measures how long an application takes to run.
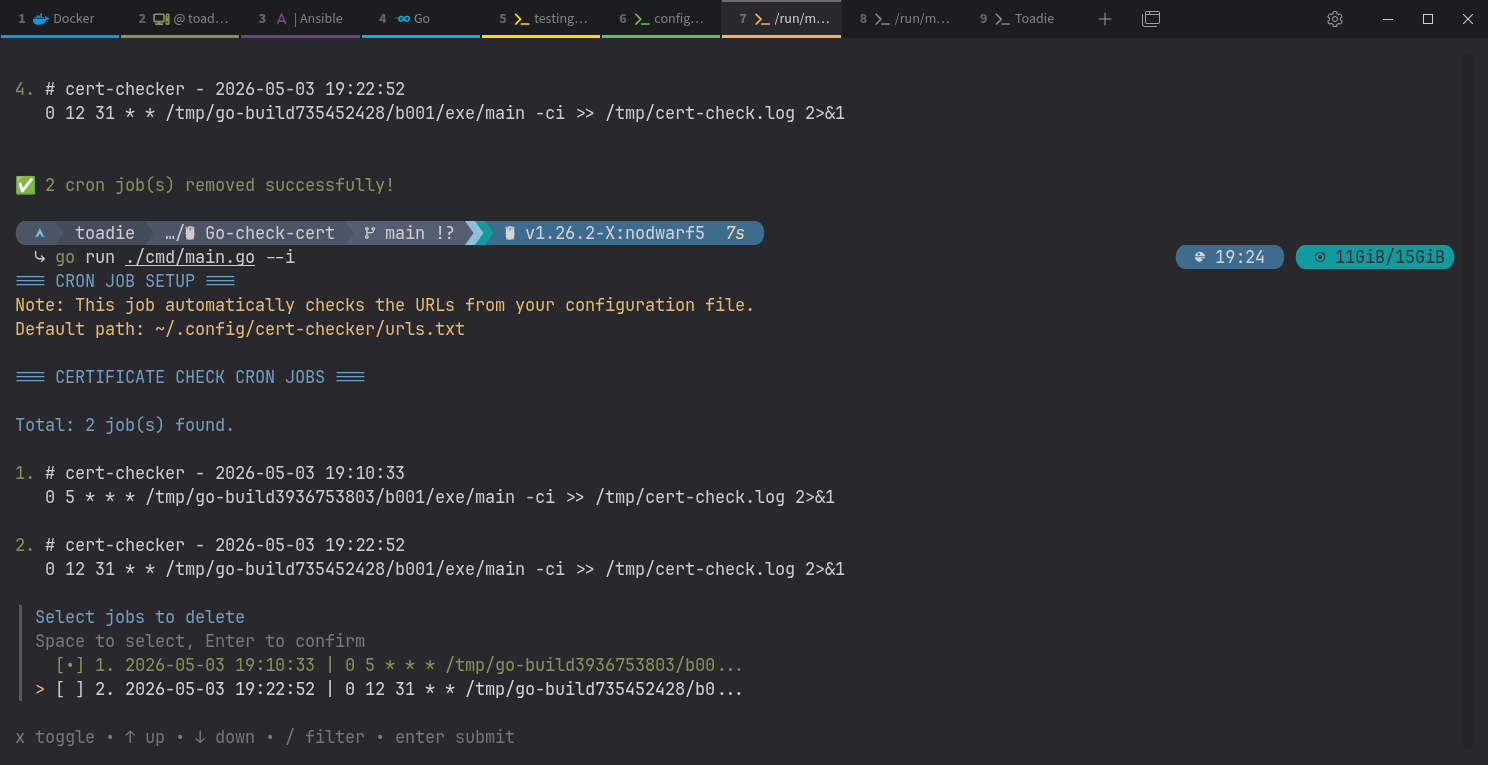
7 seconds for the version without parallelization (20 URLs).
With parallelization, 4 seconds—but with a list of 100 URLs!
That’s enough for me, and what I see serves as a basis.
5 Likes
Don’t forget to ![]() this project and in general on GitHub guys. It goes a long way!:
this project and in general on GitHub guys. It goes a long way!:
Click to star if testing, or followiing progess:
3 Likes
Hey, thanks a lot @hydn!
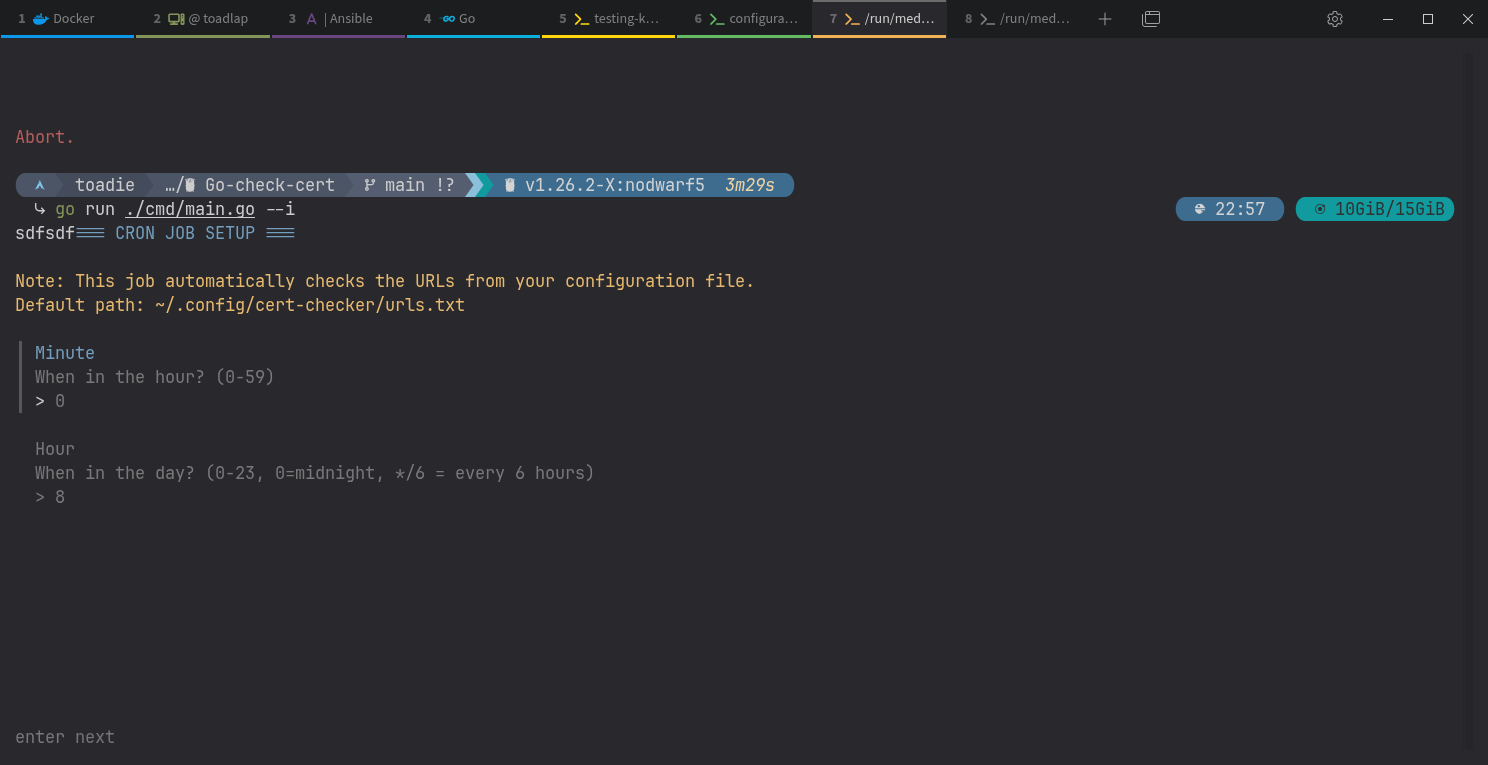
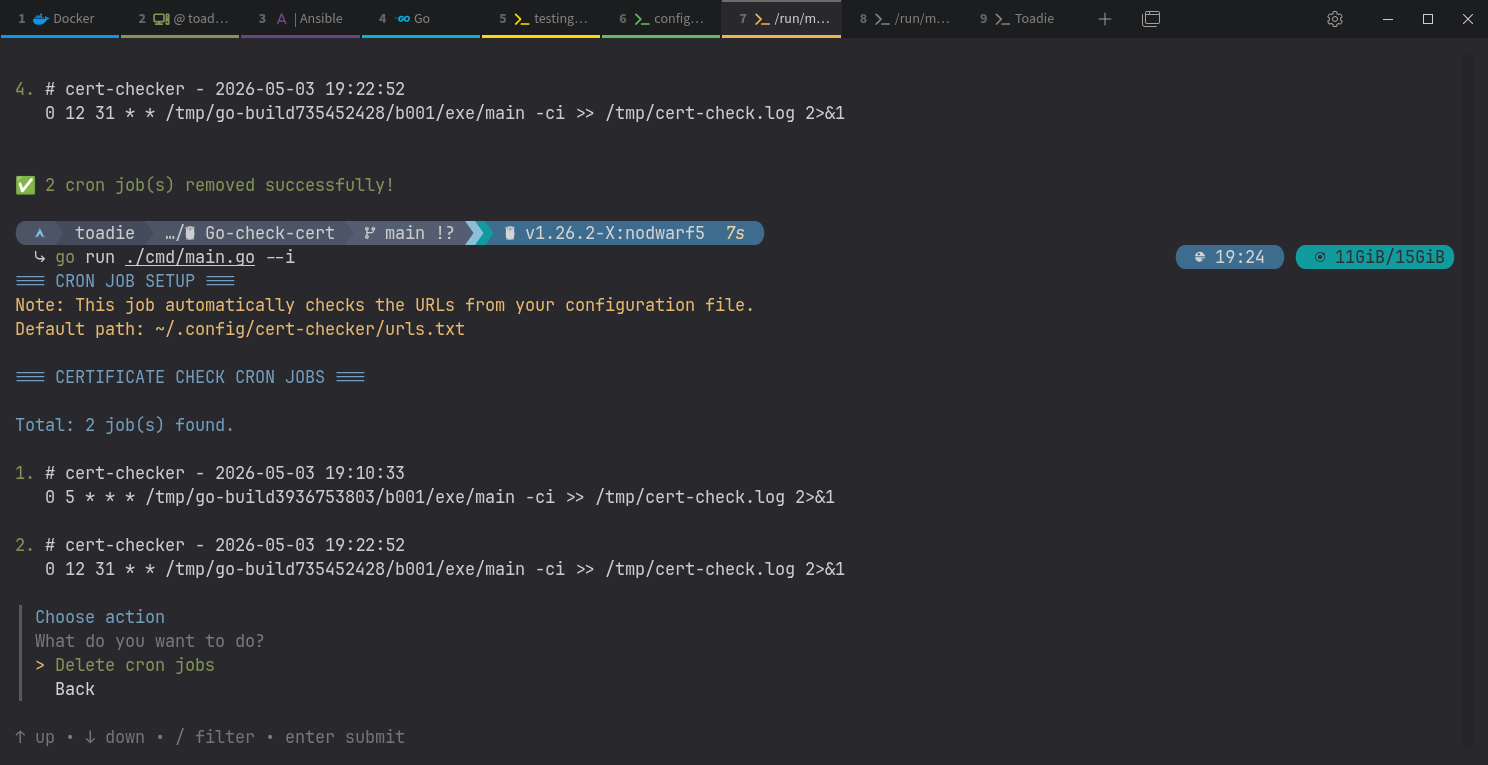
I’d like to add a feature for periodic checks. I’m not sure yet whether to use cron or systemd.
1 Like
Personally I’d go with cron, it’s less complex, universally available, and no extra files to manage.
I guess systemd is worth considering if you want better logging via journald, failure tracking, or boot related features.
5 Likes
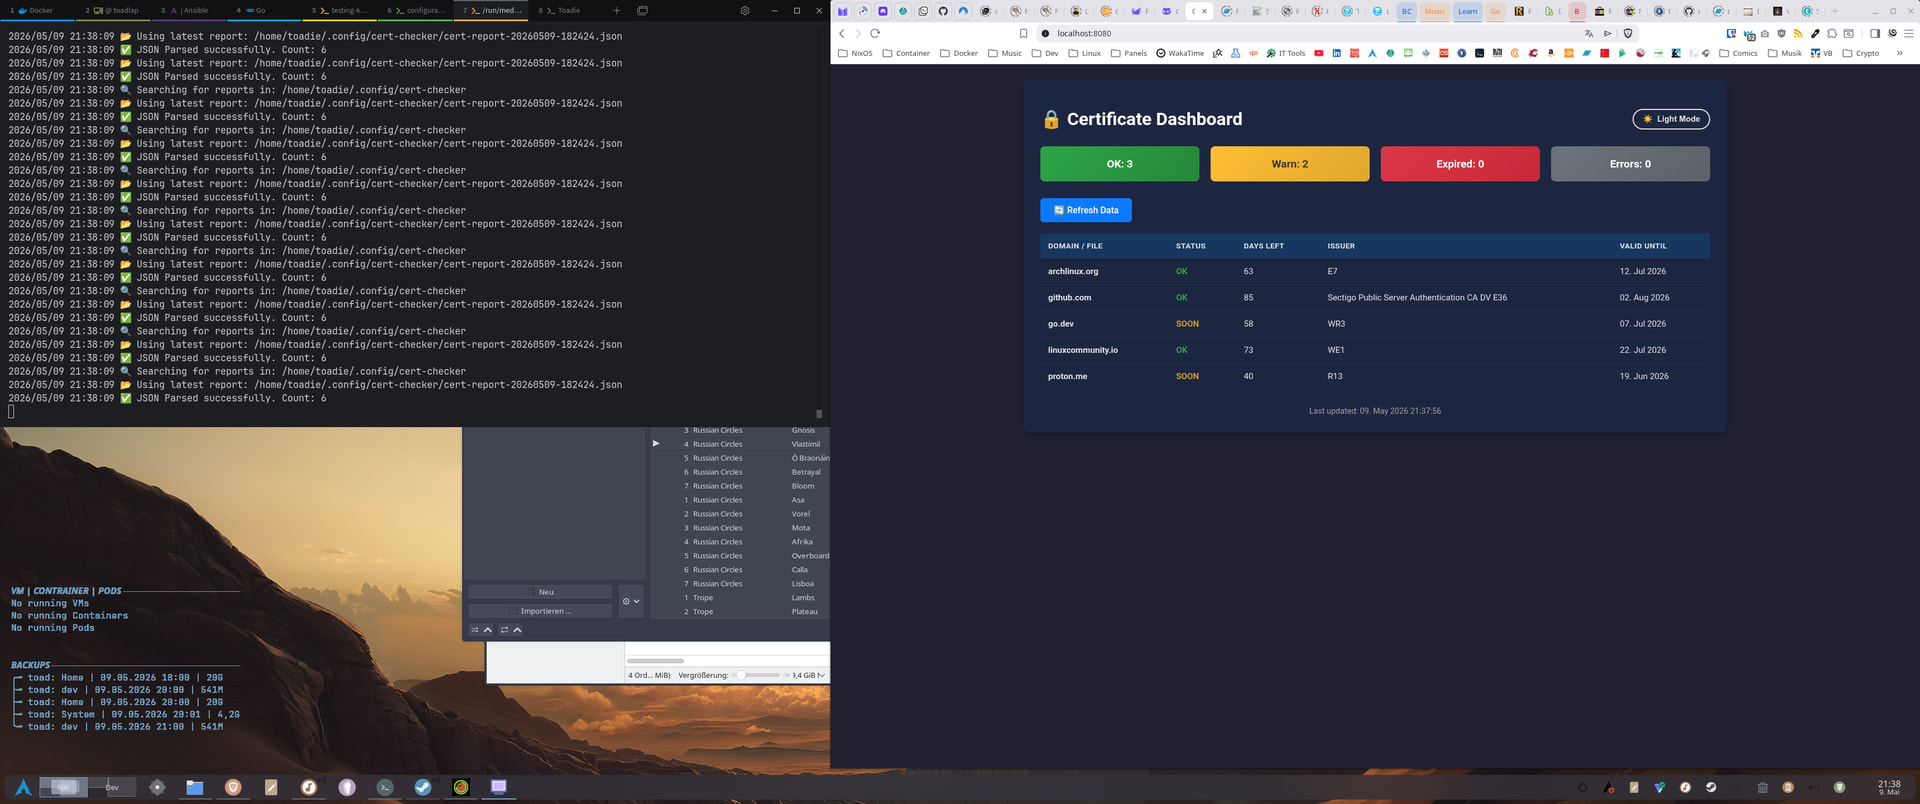
ubuntu.com is down
for a short time cert-checker showed this
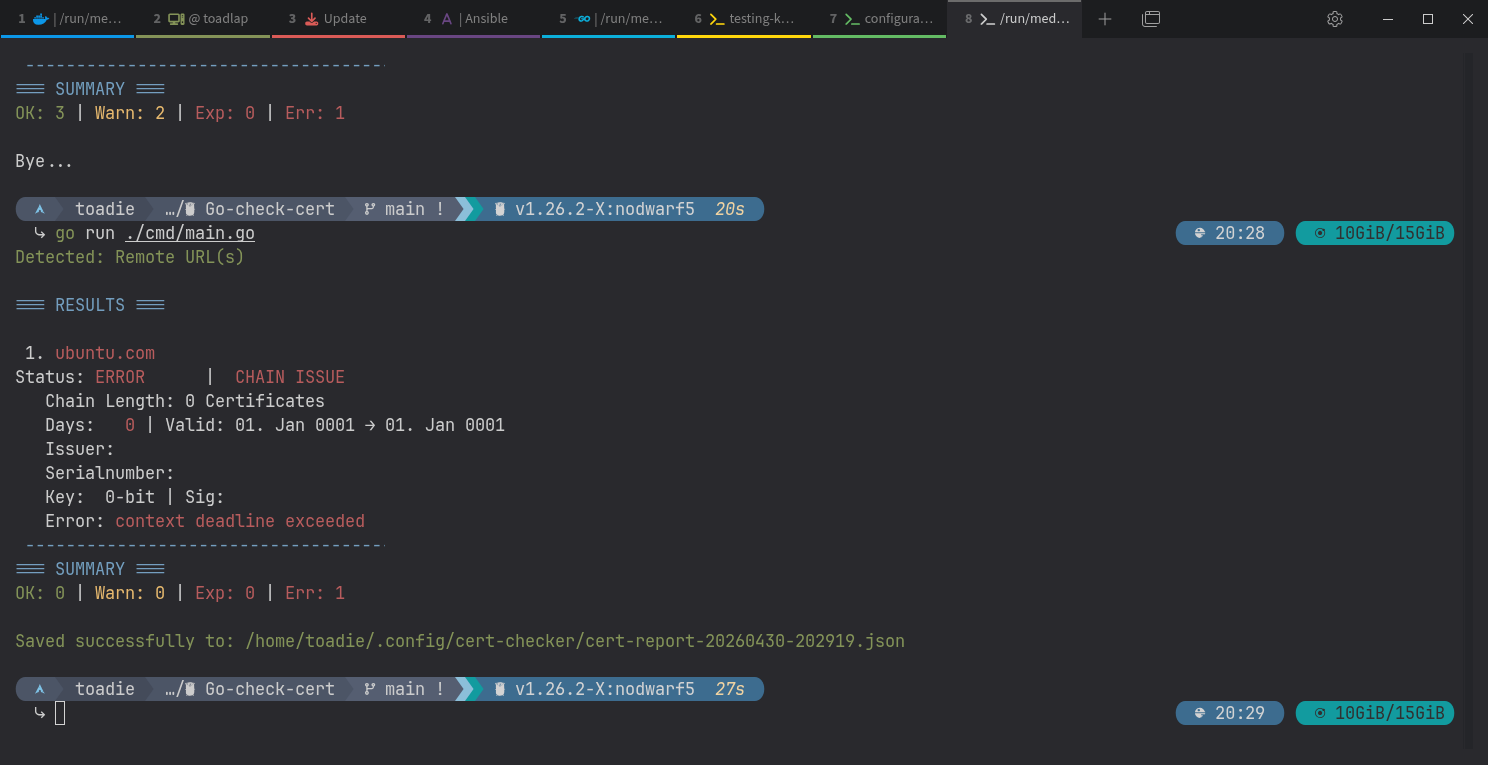
Now the cert is okay as always but the site is still down
503 Service Unavailable
No server is available to handle this request.
3 Likes
new version are up and readme is updated
4 Likes
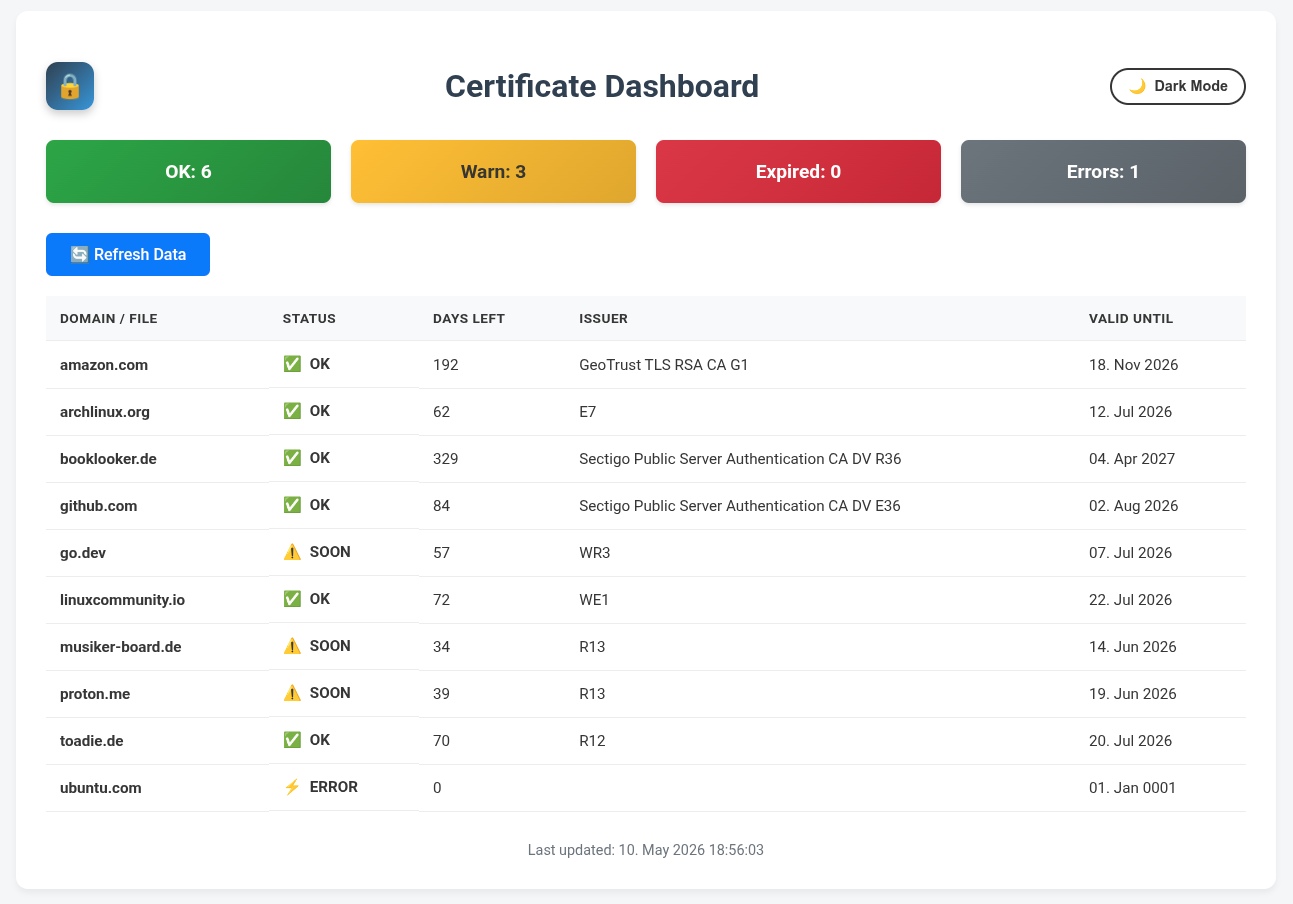
Cool !! b.t.w. does it have "dark mode " ? ![]()
2 Likes
Thanks. Uhm no not yet. Good idea
2 Likes
OMG!! That was fast !!
Looks perfect. Beautifully crafted ![]()
2 Likes
Thanks, but credit for the dashboard design goes to Lumo from Proton.
But I really like it too; I don’t know what could be changed.
3 Likes
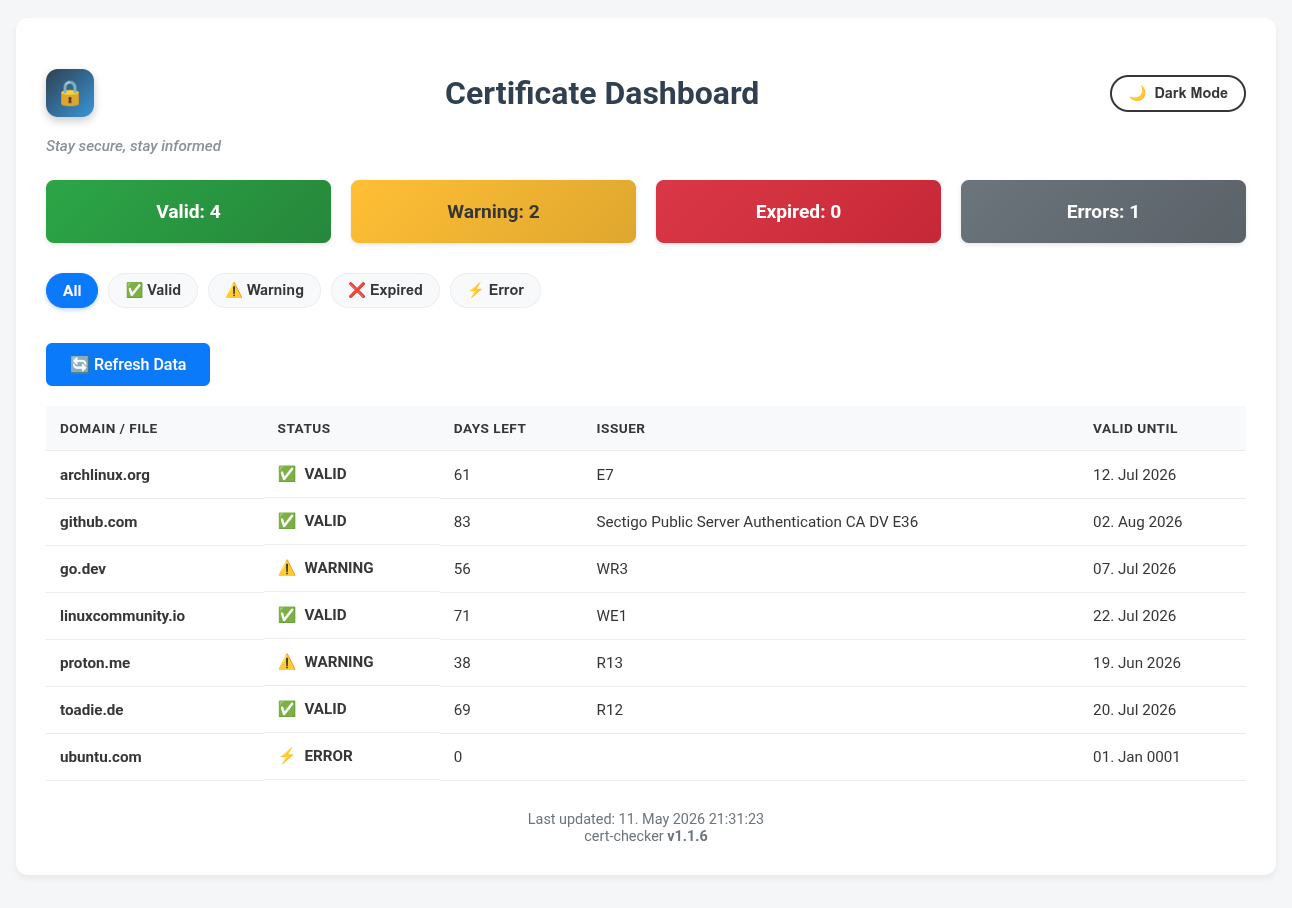
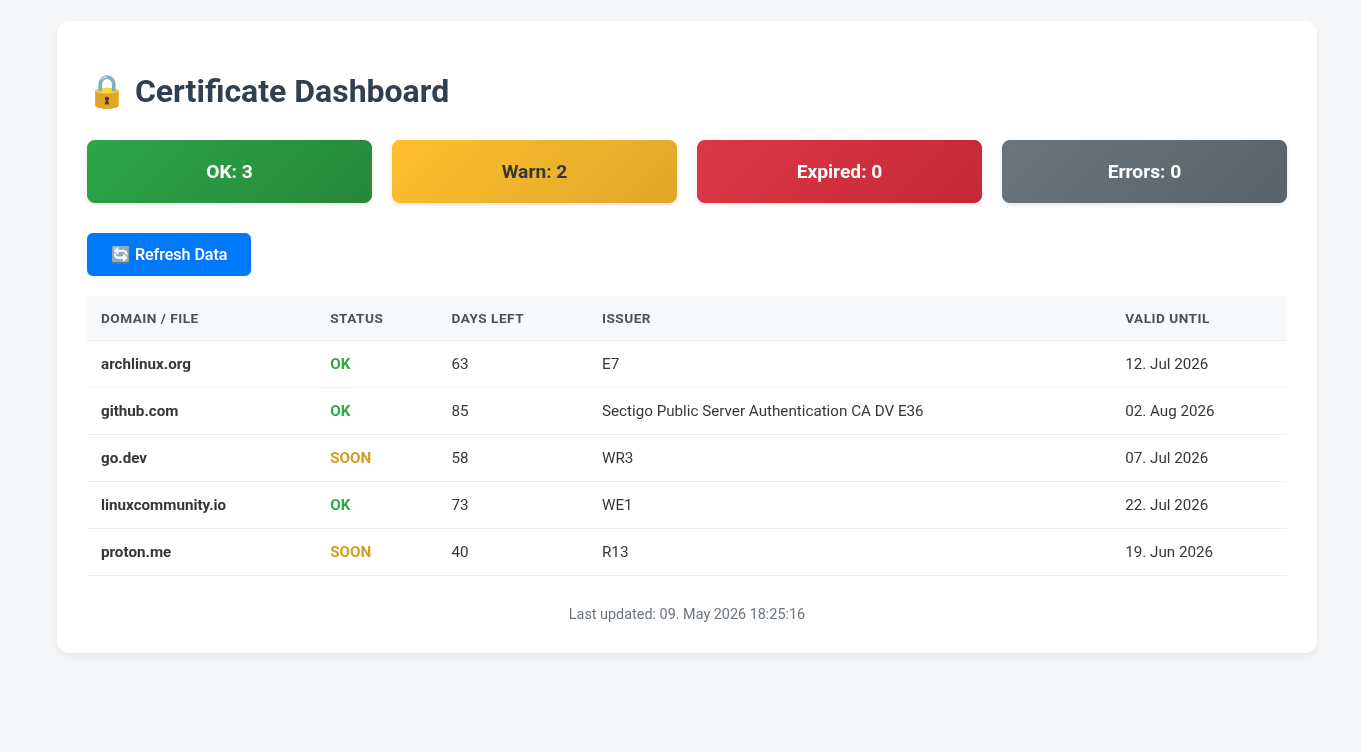
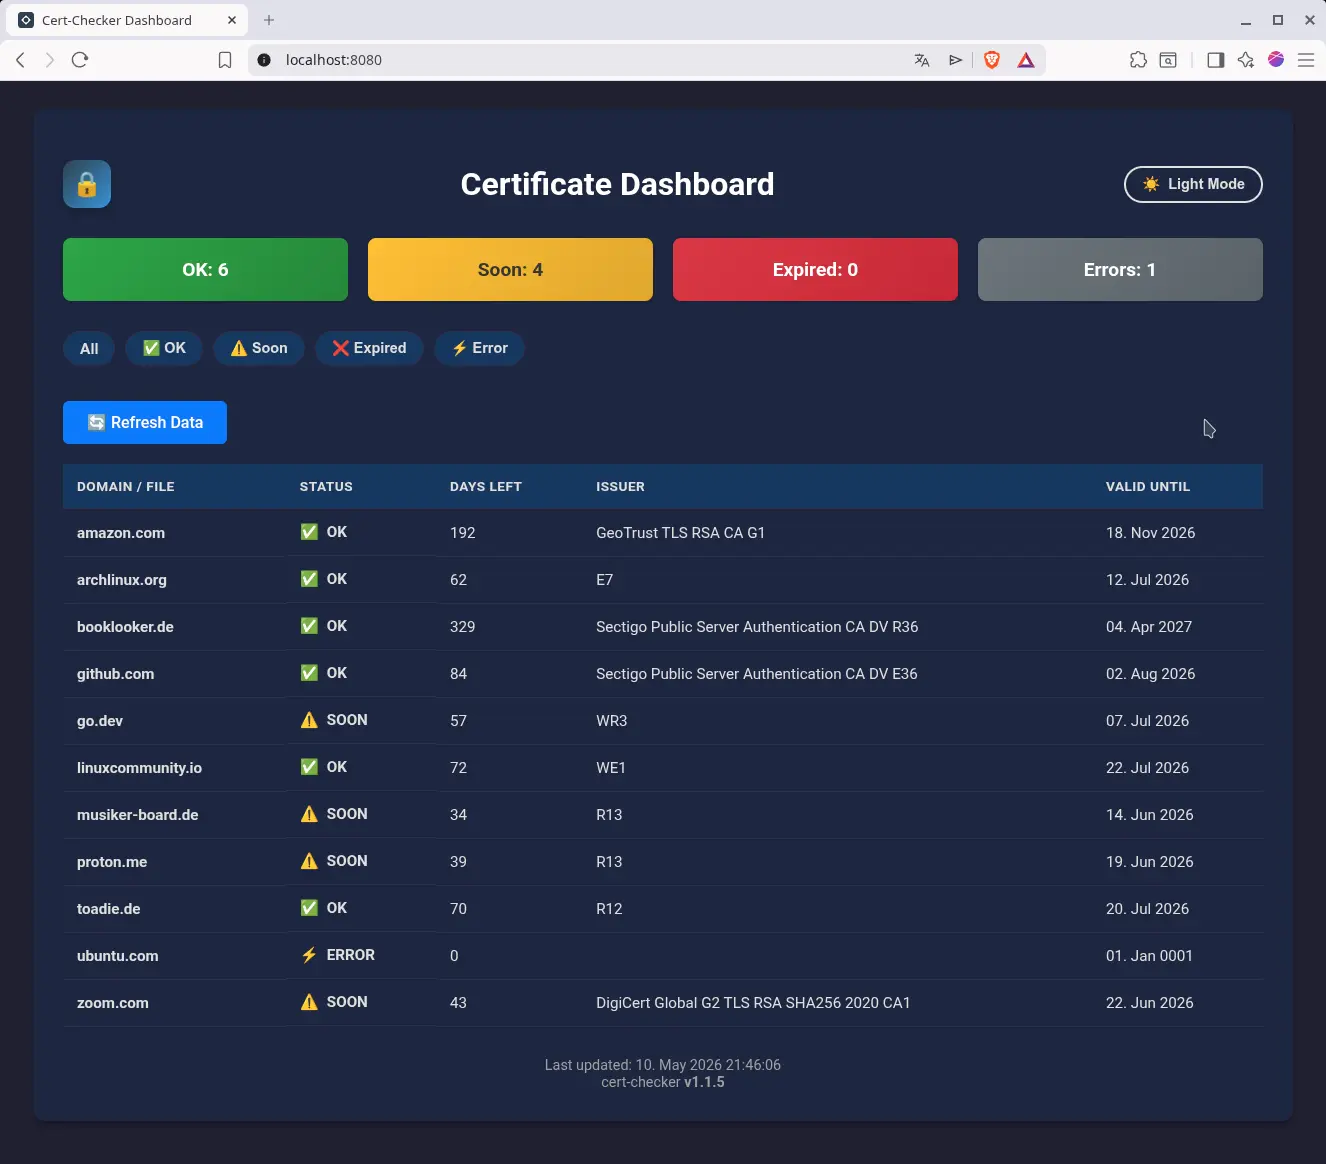
So now the dashboard reads multiple JSON files and merges the content so that nothing is displayed twice.
I still have a few ideas that I might implement—what do you think?
- Filter display by status (click “OK” to show only entries that are OK), etc.
- Run “server” as a service permanently in the background
- Browser notifications
- Database for statistics or tracking
4 Likes
Any thoughts?
4 Likes
Well, regarding button labels:
- “Ok” is a bit misleading for my taste. I’d propose “Valid”
- Probably “Expiring”, “Warning” or “Attention” instead of “Soon”
3 Likes