Discuss, question and suggest below.
In surprised you didn’t add grafana+telegraf+influxdb or Prometheus to that list. ![]()
Hi Ben, Grafana and Prometheus are listed at the end. But will add the others. Thanks for making the suggestions. ![]()
Edit: Added Telegraf and Influxdb.
1 Like
My mistake I must not have seen them. Thanks for the reply. ![]()
2 Likes
Nice list. I have been meaning to check some of these out.
1 Like
Many thanks for the list of free monitoring tools! It’s useful information. Nevertheless, I would like to have information of the impact on the performance of the server it’s running at. If there is any.
Regards, Anjo Slager.
2 Likes
Good question. Most are negligent, but sometimes yes, some tools impact performance noticeably.
Generally those SaaS or self-hosted tools with agents generally have negligent performance impact as you only need to install an agent on each monitored host.
It would be great if vendors include that type info, on performance impact, as it is indeed important.
Oh and welcome to the community! ![]()
2 Likes
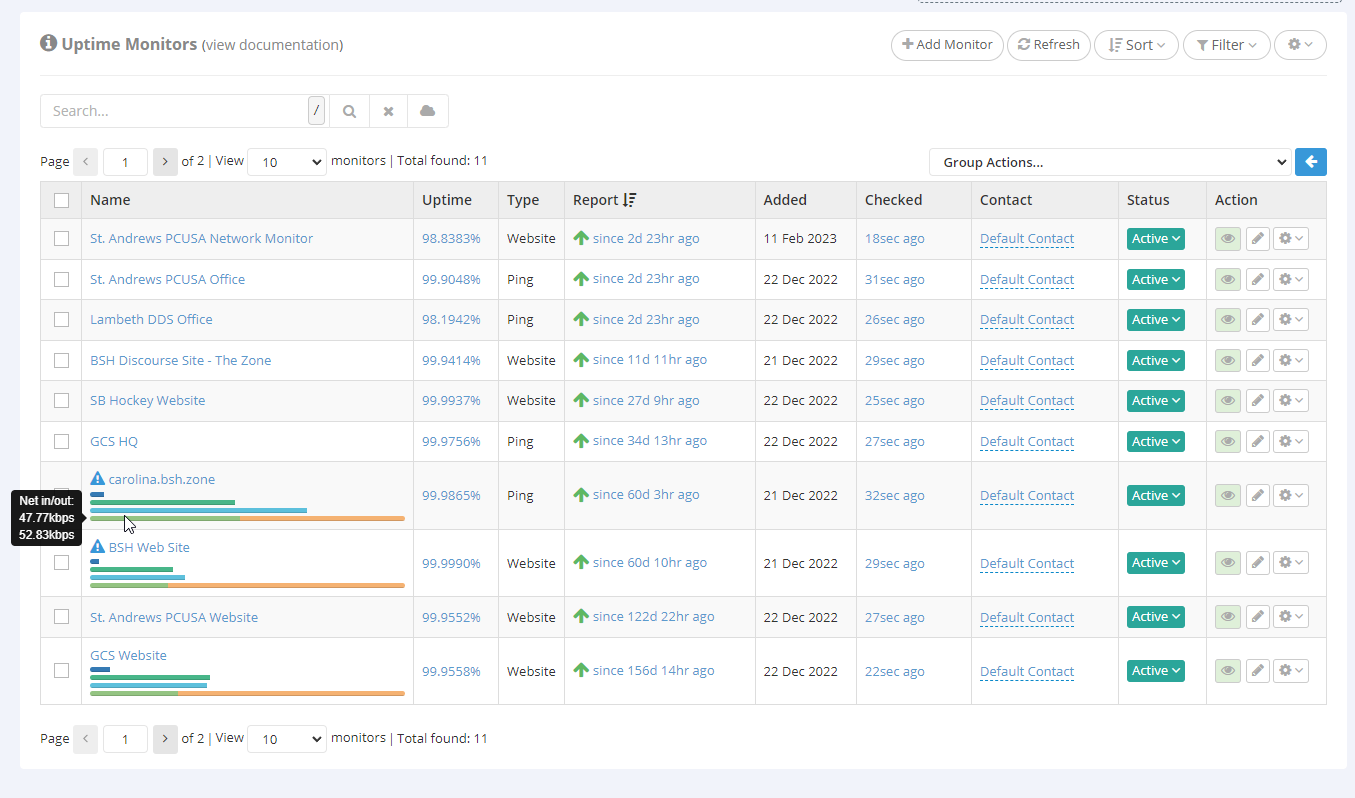
I have greatly enjoyed Hayden’s articles on Linux server monitoring, glances for one is now in use, that I learned of through his blog. I don’t see HetrixTools mentioned on this site, so I thought I’d do a PSA.
In my career I have used many high $ commercial tools. Now semi-retired I use uptimerobot, new relic, freshping, runzero, and others. I stumbled across hetrixtools dot com and continue to be impressed. From their dashboarding to the ease of installing their agent for detailed stats to alerting to geographic connectivity and blacklist monitoring.
I have no affiliation with them. Check them out, you will not be disappointed.
I’m just going to post an image of my Uptime Monitors dashboard cause that’s all I will be permitted. Sorry, I am not permitted to post a link. That site you see highlighted is actually the host system for the Discourse forum I self-host / admin.
@hydn - Actually, it took me 15 minutes to post this due to the restrictions. My site is not so tight, so this will probably be my last post. There are other ways to trap spam, my friend.
3 Likes
@kgrier Thanks for sharing. The forum is set to the default spam settings. It works very effectively. You fall into a very infrequent group which is: new members whose first post contains external links. Nothing is perfect, life isn’t perfect and the built-in anti-spam isn’t either. But 99% of the forums use this method to avoid members being exposed to not only spam, but also malware/scam links from bots etc.
1 Like
That’s a great looking tool. Thanks for sharing
1 Like
I'm a writer now that I'm old and portly. Doing mostly online books, I discovered a
tool that I use all the time for transforming cvs files for the web. Pandas has made my
life much easier and works well.
3 Likes
@hydn @superuser1955 @Ben actually you can do this with the following approach.
$brew install nushell
# it is a rust based shell programming language
$ do { netstat } | save networkconnection.txt | open networkconnection.txt
# if you want to get the columns then you can also add
| columns
# if you want to make this as a sleep then you can add
alles super,
GauravI don’t know if I missed it but didn’t see LibreNMS on that list. With a host of plug ins that have been built in, it allows the user to customize the system monitoring. And it has has a vibrant community that keeps on developing personalized plugins for it.
2 Likes
@Slys @hydn @Ben @Slys @Anjo @Ben @kgrier thank you all for the discussion. Please find a complete setup for the nagios which i use sometime in addition to Grafana.
$ sudo apt-get install -y gcc glibc glibc-common perl httpd php wget gd gd-devel
$ sudo apt-get install -y gcc glibc glibc-common make gettext automake autoconf wget openssl-devel net-snmp net-snmp-utils
$ systemctl start httpd
$ systemctl enable httpd

# Installing the Nagios and adding a user to the Nagios
https://assets.nagios.com/downloads/nagioscore/versions.php

$ wget -O nagioscore.tar.gz https://github.com/NagiosEnterprises/nagioscore/archive/nagios-4.4.8.tar.gz
   tar xzf nagioscore.tar.gz
   cd nagioscore-nagios-4.4.8/
$ ./configure
$ make all
$ make install-groups-users finishing the installation of the nagios with the defined user group.
$ usermod -a -G nagios apache
$ make install
$ make install-daemoninit
$ htpasswd -c /usr/local/nagios/etc/htpasswd.users nagiosadmin enabling the httpd
$ make install-commandmode
$ make install-config
$ make install-webconf

# Check the configuration file

cd /etc/apache2
apachectl configtest

# Installing the Nagios plugins:

$ wget --no-check-certificate -O nagios-plugins.tar.gz https://github.com/nagios-plugins/nagios-plugins/releases/download/release-2.4.1/nagios-plugins-2.4.1.tar.gz
$ tar zxf nagios-plugins.tar.gz
$ cd nagios-plugins-release-2.2.1/
$ ./tools/setup
$ ./configure
$ make
$ make install

# If you are downloading it from CPAN: https://metacpan.org/dist/Nagios-Monitoring-Plugin

$ perl -MCPAN -e shell
$ cpan install module
$ perl -MCPAN -e 'install Nagios::Monitoring::Plugin'
Nagios::Monitoring::Plugin	A family of perl modules to streamline writing Nagios plugins
Nagios::Monitoring::Plugin::Config	read nagios plugin .ini style config files
Nagios::Monitoring::Plugin::ExitResult	Helper class for returning both output and return codes when testing.
Nagios::Monitoring::Plugin::Functions	functions to simplify the creation of Nagios plugins
Nagios::Monitoring::Plugin::Getopt	OO perl module providing standardised argument processing for Nagios plugins
Nagios::Monitoring::Plugin::Performance	class for handling Nagios::Monitoring::Plugin performance data.
Nagios::Monitoring::Plugin::Range	class for handling Nagios::Monitoring::Plugin range data.
Nagios::Monitoring::Plugin::Threshold	class for handling Nagios::Monitoring::Plugin thresholds.

# Restarting the system and the nagios service

$ systemctl restart httpd.service
$ systemctl start nagios.service
$ start nagios service
$ nagios service status

# Two ways to start firewall, either in the system enabled or the cloud enabled.

$ firewall-cmd --permanent --zone=public --add-port=80/tcp
$ firewall-cmd --reload
or

# google cloud enabled

$gcloud compute --project=projectname firewall-rules create firewall-8080 --direction=INGRESS --priority=1000 --network=default --action=ALLOW --rules=tcp:8080 --source-ranges=0.0.0.0/0

# Check the Nagios on http://localhost/nagios or http://externalip/nagios
alles super,
Gaurav
1 Like
I have been using Linux now on my older laptop since around 2019 and even though I have been using it that long, I am still learning so much about it and what it is capable of doing.
Having access to this list of monitoring tools will be a great help, thank you for sharing.
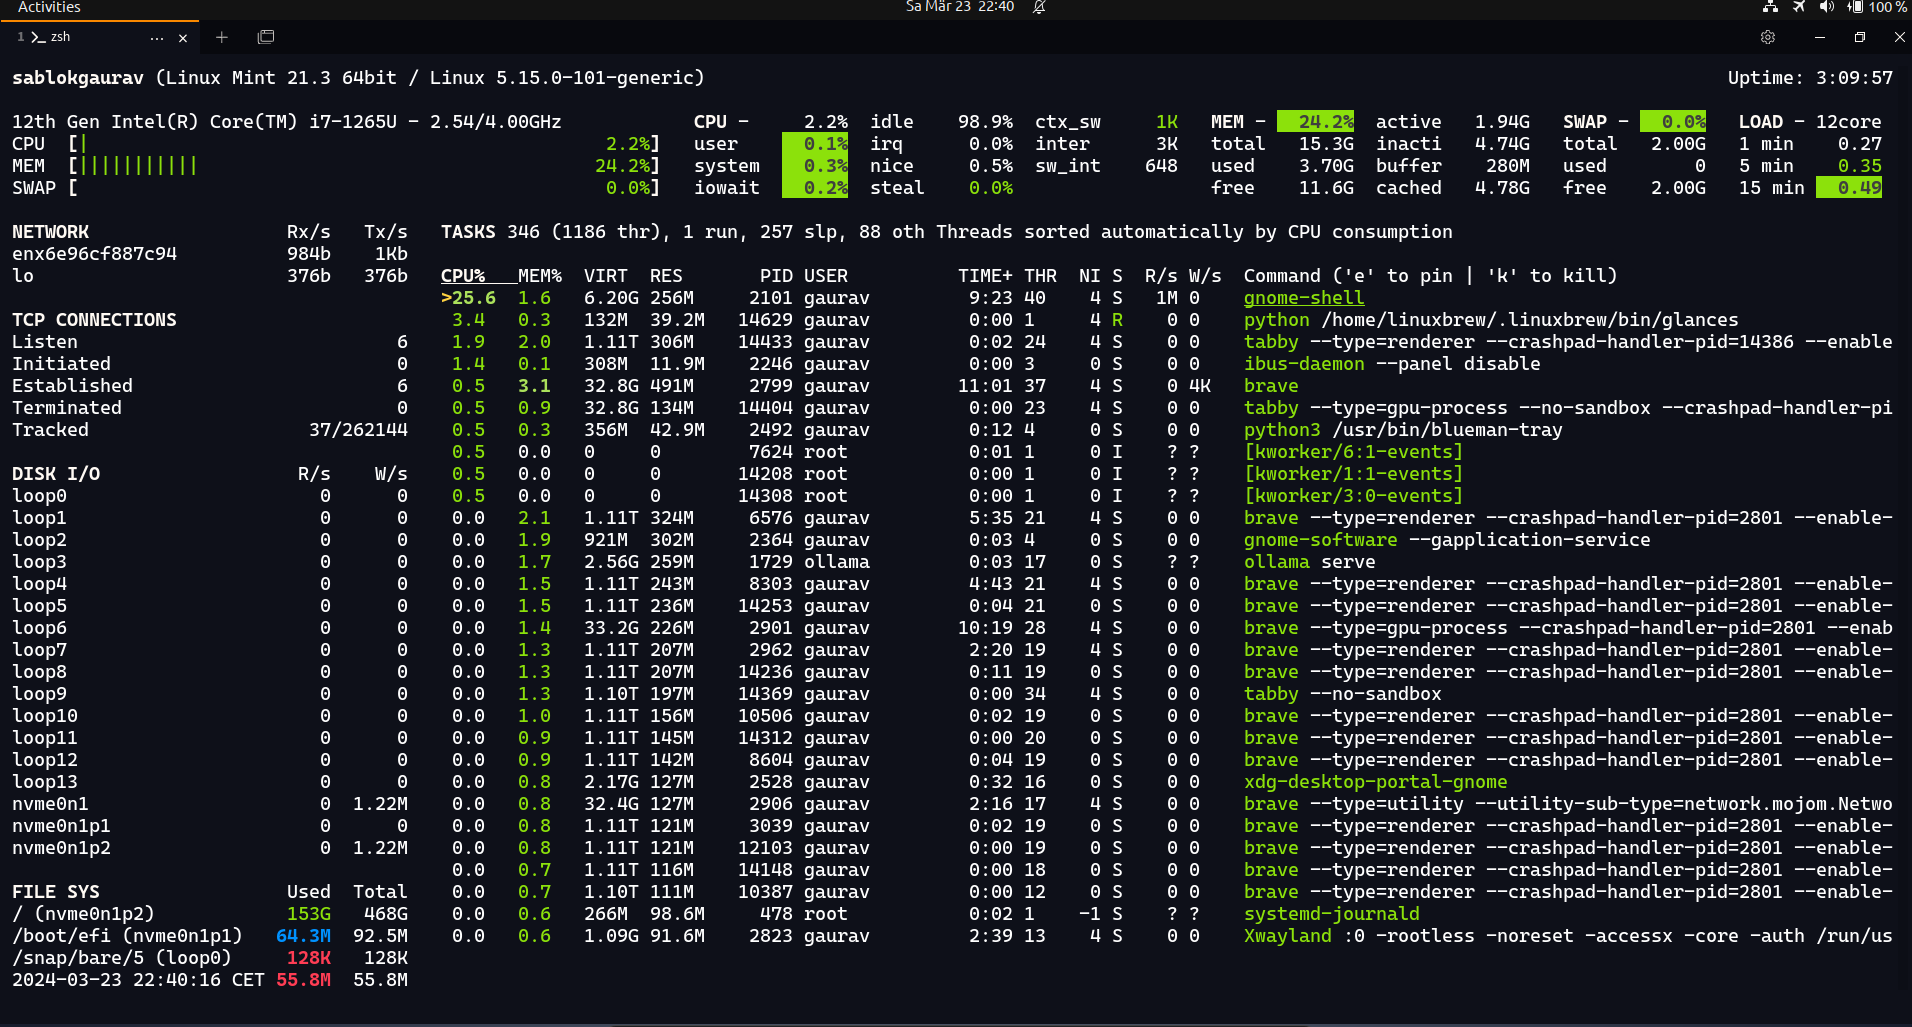
@DavidP I like Glances. Except, I prefer how top and htop show “cached” memory as “available” and not part of “free” memory. “free” memory (aka completely unused) is wasted memory, while “available” memory is actually used memory often cached that can be easily freed if the system needs it.
I don’t think default glances makes that as clear as top, htop, btop, atop, etc.
@hydn yes thats true. I havent used glances much. I also used the same others, which you have mentioned. I finished GOlang in a week and then another week with some more detail and taking this week as the last one. I am now building a cloud native application using GOlang apart from coding a complete genome web browser so in total two application: 1. One cloud native and 2. a web based genome application. the cloud native application you will like, i invoked some C++ into it and started coding 2-3 days ago after finishing GOlang and i think in next 2-3 days I will release the first version. I hope you are doing well. Stay tuned, Gaurav
1 Like
It’s been a while, awesome to see you and for the update.