Hi folks,
I would like a program that can view alerts and logs all in one place. Kind of like a SEIM but not for business or multiple computers. I run Debian if that helps any, I looked at Octopussy and it might be a dead project (insert choice cuss words here) so I’m back to the drawing board.
I found Collectd but it doesn’t have a display (big sad) all I want to do is view things from a single interface on my local machine without using the cloud. I didn’t think it would be that much of a challenge; apparently I thought wrong ![]() (not a big shock there).
(not a big shock there).
Suggestions???
Do you like Docker?
If so, splunk is very light weight in docker, under 500mb ram. You can ship your logs to the splunk container.
I’ve never set it up actually. It seems kind of pointless one a single user system; unless I’m trying to add to my skill list. But I’ve never tried Docker or any containerizing on the machine I’m on.
I find it amazing that nobody has made an easy way to view everything in one interface for a single user machine. You would think there would be one out there that isn’t ridiculously tedious to set up.
After all there’s multiple programs to view all the documentation in one place (dhelp, doc-base, etc) why isn’t there any easy way to view all the log files?
How about installing locally without docker?
If you don’t like splunk, how about GrayLog?
if you want a simple UI, you can look at front tail. I use it monitor my fw logs. ![]()
Well, Greylog looks promising, but it needs to be free and not cloud based. Frontail is kind of an idea. When I reboot my computer I get a message about prometheus-nextcloud-service not being enabled. I do have a Nextcloud account for “off-site” back ups. Maybe I should look into how much of a PIA that would be to set up?
I’m trying to find something that will tell me an IP or IP6 address has been rejected n amount of times in blah time frame and out puts the address. so I can figure out if I need to make IP Tables (I guess it’s NF Tables now) to drop the address or allow it.
I’d also like to be able to see which process is using my CPU the most and if it’s because it’s zombied or orphaned. You know basic stuff that I shouldn’t have to go to 50 different log files to see. Kind of like (I don’t believe I’m about to give Windows a compliment for doing something useful) Event Viewer in Windows, if that makes sense.
I mean, this really comes down to your personal usage. I can recommend a few but you will have to look into it if it will run smoothly on your system. I don’t see why my suggestions wouldn’t.
I would look into LOGalyze, KSystemLog, Multitail, or Glogg. I would have also suggested Frontail but I see that was already suggested. Still a great option!
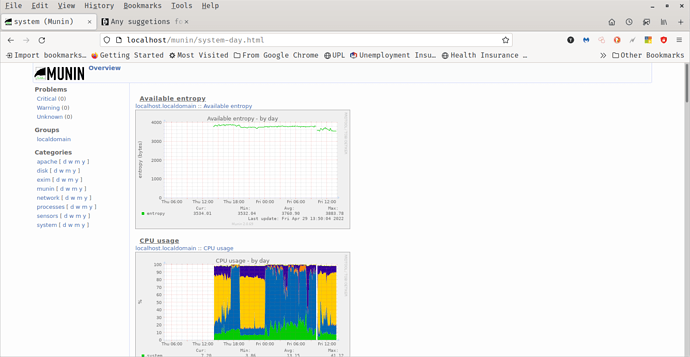
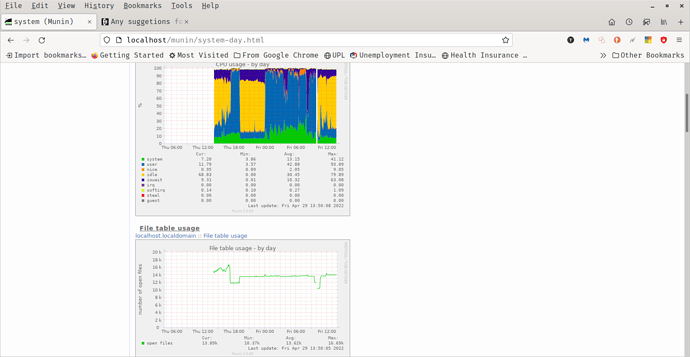
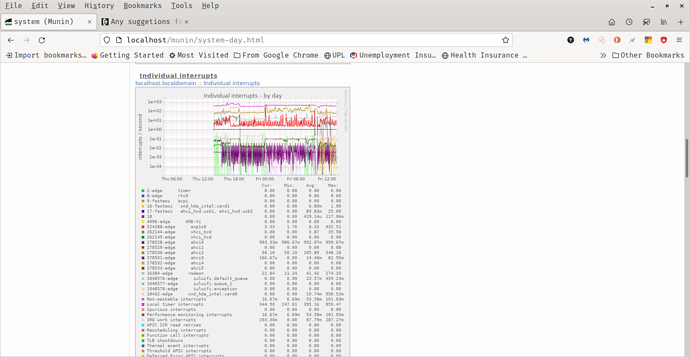
Well I found one, turned out to be called Munin. https://munin-monitoring.org it graphs stuff and has a pretty nice output. It’s easy to set up via the package installer for Debian. I guess syslog is about the same as KDE System Log reader so that was my second option.
Thanks for the advice.
I did forget to mention I had Firewall logger installed already, maybe I can figure out how to make it be more alert friendly with Munin.
There are some tweaks and workarounds for that one. You just have to go through trial and error from what I understand when it pertains to Munin.
Keep us posted!
There are Free-always plans for SaaS solutions; with some limitations.
These free plans should be fine for smaller projects:
For self-hosted solutions you have:
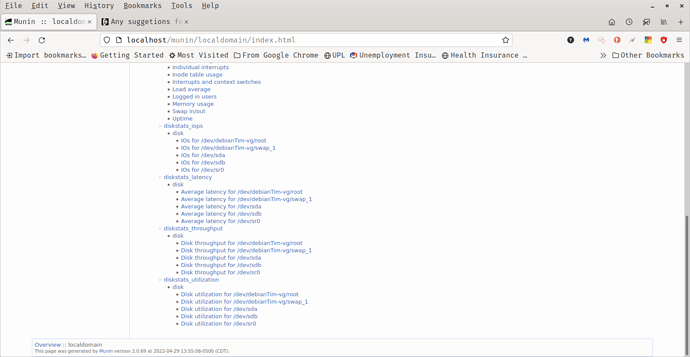
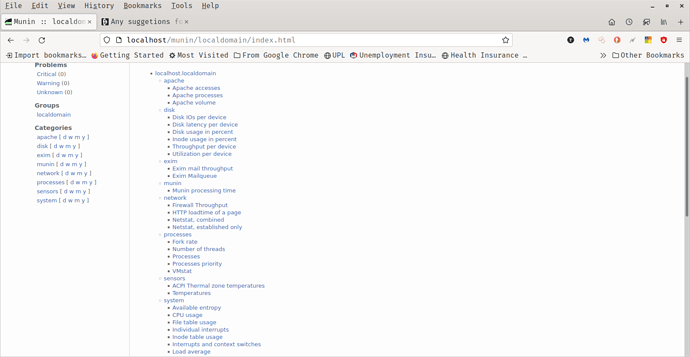
I looked the ones that have been suggested so far and I’m going to stick with Munin. It seems to be most of what I’m looking for. The ones that claim to do what I want are out of my current price range or use a SaaS, I’ll get Munin to cooperate more to my liking. It’s interface is fairly clean and understandable. Here’s a couple of screen shots
Good to hear you found a solution ![]()
Here are some options for anyone else finding this thread:
- Echofish - A web based real-time event log aggregation, analysis, monitoring and management system.
- Elasticsearch - A Lucene Based Document store mainly used for log indexing, storage and analysis.
- Fluentd - Log Collector and Shipper.
- Flume - Distributed log collection and aggregation system.
- Graylog2 - Pluggable Log and Event Analysis Server with Alerting options.
- Heka - Stream processing system which may be used for log aggregation.
- Kibana - Visualize logs and time-stamped data.
- Logstash - Tool for managing events and logs.
- Octopussy - Log Management Solution (Visualize / Alert / Report).
- sexilog.fr - “Ready-To-Log” virtual appliance made by community for community!
- Vector - high-performance observability data pipeline.
You can use Collectd with a local web-based interface by combining it with a frontend tool like Grafana or Collectd Web, allowing you to view your data without relying on cloud services.
Grafana + Collectd
- Install Collectd: Configure it to collect metrics on your server.
- Install InfluxDB or Prometheus: Use InfluxDB or Prometheus as the time-series database to store Collectd’s data.
- Install Grafana: Connect Grafana to your time-series database.
- Local Dashboard: Access Grafana from your local machine for a rich, customizable interface.
Collectd Web
- Collectd Web is a simple PHP-based frontend that reads data from the RRD files created by Collectd. It’s lightweight and runs locally without needing a full database setup.
- Install Apache/Nginx, PHP, and the
collectd-webpackage. Point it to your Collectd RRD files.
These solutions let you view all your metrics without relying on cloud-based monitoring.
Thanks Devdev, I’ll have to give that a whirl ![]()
