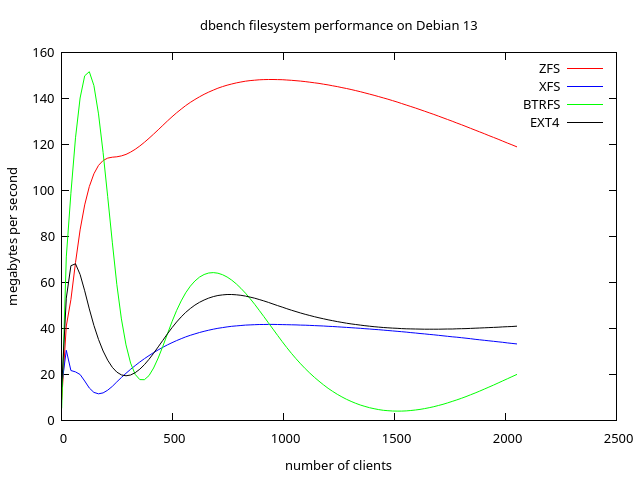
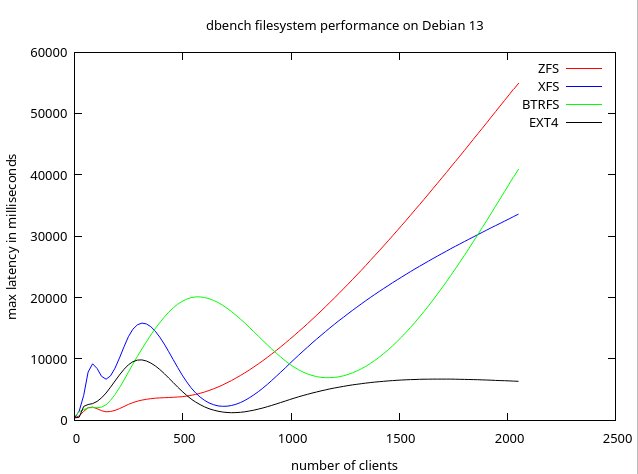
I’m performance testing zfs, xfs, btrfs and ext4 on a Debian 13 VM, and the results so far are interesting. In dbench testing, zfs has highest throughput, and ext4 has lowest latency.
You can see that at low load, e.g. just a few i/o streams, BTRFS comes out on top, so it would be fine for a general purpose multimedia and gaming desktop.
But server usage is a different story and ZFS throughput is great under high load, while ext4 latency remains low under heavy load. In contrast, BTRFS performance falls off under heavy load.
@J_J_Sloan Thanks for taking the time to run and share these benchmarks.
If you happen to have it handy, it might help readers interpret the results even better if a bit more context around the test environment were included. Things like the VM configuration (vCPU count, RAM), underlying storage type (NVMe vs SATA, host filesystem), ZFS pool layout and recordsize, and whether any non-default mount or tuning options were used can make a meaningful difference in how these numbers are read.
Totally optional, of course! But this has peaked my interest. So even a short summary would add a lot of clarity for anyone trying to compare this to their own setups or reproduce similar tests.
Either way, thanks again for posting the graphs and results!
why are you smoothing the graphs? These are discrete data points. Consider unsmoothed lines between each point (and marking the actual data points on the graph), or perhaps a bar chart.
what are you testing on? Is the underlying hardware is ssd, hdd, raid etc. Are you testing on a raspberry pi? A laptop? A consumer CPU? An enterprise CPU? A cloud VM instance?
what is your test methodology? Does “MB/s” graph label refer to disc writes, disc reads, or a mixture of both? Is this small files, large files, random access etc?
Anyone who’s unable to mindread your test process and hardware environment will find that these graphs are meaningless.
You graphs suggest that both ext4 and btrfs have a performance dip at around 350 clients. That’s potentially interesting, if you wrote this up properly and visualised the data properly.
Hardware details:
Host: Proxmox 9.1.2 on Dell Optiplex 3000
VM: Debian 13, 2 VPCUs, 4 GB RAM
Guest disks are running on host HDD
In dbench, the “MB/s” graph label refers to the following:
Mix of Reads and Writes
The MB/s throughput reported by dbench represents a mixture of both disk reads and writes.
Dbench is designed to emulate the I/O patterns of a real application (specifically a file server under NetBench-style load).
In its default configuration, it is heavily weighted toward writes, with approximately 90% of operations being writes and only 10% being reads.
Access Pattern and File Sizes
The workload is not a simple “large file” or “random access” test but a complex sequence of operations based on a “loadfile”.
File Sizes: It manipulates a pool of files ranging from a few kilobytes up to approximately 20 megabytes.
Access Pattern: The operations include a mix of sequential and random-like activity, including opening, reading, writing, closing, and deleting files, as well as directory operations like renaming.
Concurrency: The throughput reflects these operations being performed by multiple concurrent “clients” or threads (e.g., 10, 100, etc.), making it a test of how the filesystem handles high metadata and I/O contention
Even if the hardware details were not known, the relative performance is informative.
Did you write point 3 of your response with an LLM?
Alongside the hardware you used, it’s also important to know which kernel version you used and which version of zfs did you use.
Even if the hardware details were not known, the relative performance is informative.
Is it?
We now know you’re benchmarking on an HDD. People using these filesystems on an SSD may expect very diferent performance. I would dispute that you could compare an HDD filesystem benchmark with an SSD filesystem benchmark, due to the seek latency affecting filesystems differently.
Is 2 vcpus enough to serve the load of 2000 clients? Probably, but maybe not? Without knowing the number of cores people can’t judge whether the benchmark results might be applicable to their own environment.
“Did you write point 3 of your response with an LLM?”
Google AI was able to provide the answer you sought. Is that a problem for you?
“Alongside the hardware you used, it’s also important to know which kernel version you used and which version of zfs did you use.”
These are all straight Debian 13 standard:
Kernel: 6.12.57+deb13-amd64 #1 SMP PREEMPT_DYNAMIC
ZFS: version 2.3.2-2
“We now know you’re benchmarking on an HDD. People using these filesystems on an SSD may expect very diferent performance. I would dispute that you could compare an HDD filesystem benchmark with an SSD filesystem benchmark, due to the seek latency affecting filesystems differently.”
OK.
“Is 2 vcpus enough to serve the load of 2000 clients? Probably, but maybe not? Without knowing the number of cores people can’t judge whether the benchmark results might be applicable to their own environment.”
Feel free to prepare a test environment, run and record benchmarks and provide full documentation.