Originally published at: btop - the htop alternative
Have you ever experienced slow application performance on a server and wondered which process was causing the bottleneck? In a production server environment, monitoring system performance and hardware resource usage in real-time is crucial. That’s where system monitoring tools come in handy. And, with the availability of numerous command-line system monitoring tools, you’re spoiled for…
btop is pretty nice but top is still king ![]()
I am not a server farm admin, just a desktop Linux user. Used top in the past, moved to htop, and now I am a happy btop user. Easy on the eyes, shows everything I need to know at a glance, easy to recommend!
I can get that. Welcome to the forums Pedro.
Welcome to the forums @Pedro_Galvan
I’m an htop heavy user. What can btop do that htop cannot and how can it find bottlenecks?
Human-readable memory usage was a big one for me. htop still doesn’t have this, and there’s an open issue for it that doesn’t look to get traction any time soon, since the last comment was over a year ago.
Besides that, htop’s interface a bit clunky, and its old-school reliance on the F-Keys is kind of a pain on laptops that don’t have them. By contrast, while the adornments and truecolor stuff btop has by default might give you the impression that it’s style over substance, it actually has a had a lot of thought put into UI. It’s very easy to move around in, and has clearly-visible shortcuts and toggles for various displays. The option for braille characters in graphs is also clever, since it lends a higher effective resolution to them. The IO stuff is also quite nice.
For my money, it’s just a better experience!
Welcome to the forums! You know I never noticed that htop didn’t have human readable memory format.
With top I usually hit e and shift E the first moment I login. lol
Thanks for the input, I’m accustomed to the Fkeys and the clickable options at the bottom, but it could just be old dog / new tricks thing. ![]()
clickable:

No, the graph is actually fine! I was speaking of per-process, actually. Unless there’s a method I’m unaware of, I could find no way to get htop to give human units in the process list. I get that not everyone needs it, but for quick sanity checks, that’s usually all I really care about, and would love to have it as a toggle.
I can’t stand top ![]()
I’m a heavy htop user. I guess I like all the colors.
Haha. htop is pretty, yes! ![]()
You can add color and a few other this to top as well. See this post: Linux top: Here's how to customize it
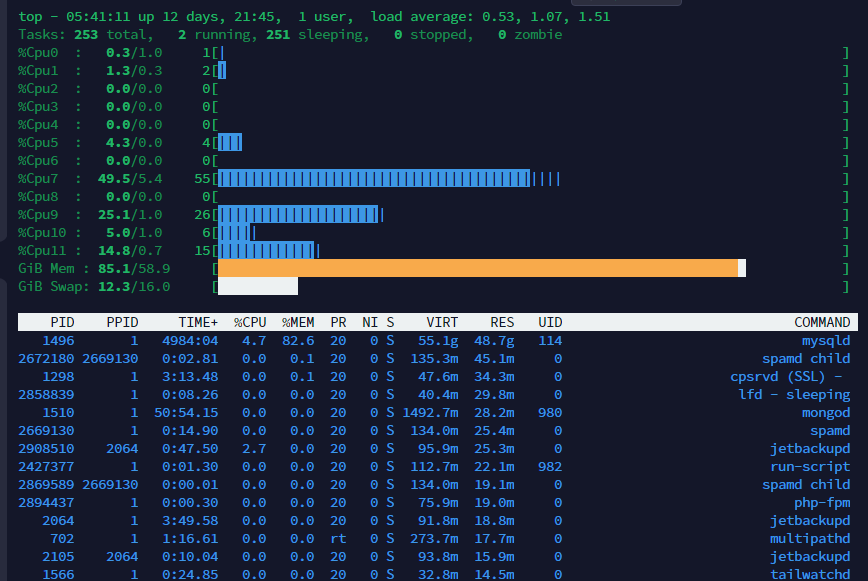
So, for example, I just tweaked top to be a bit more htop-looking and ended up with something like this:
I love the features btop brings considering how lightweight it is, I practically use my Pi as a webhost and for something with absolutely no gui, it makes looking at the details incredibly easy. Htop does not seem to run as fast.
May I ask what you are hosting on your PI (meaning raspbi pi?)
I ran a few personal projects. I’ll be running a postgres server with REST for an app soon.
BTW, I did this… and have now deleted it lmao.
Gonna redo it.
How’s it going? Did what sorry?
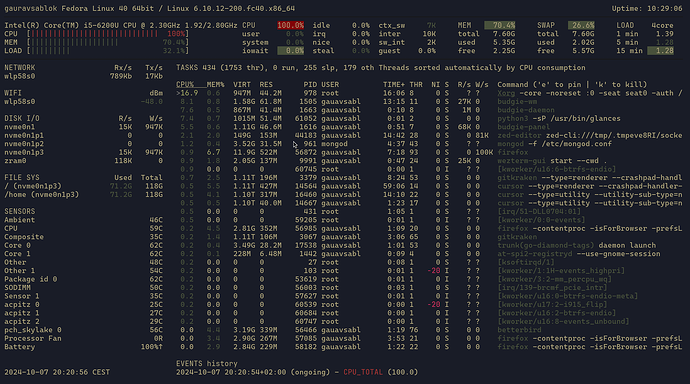
If you want then you can use the glances and to install in Fedora
sudo dnf install glances
and i use that and this is how it looks.
This is just to let you know that there are other choices also available and whether to use or not that is totally your choice. I can only suggest and i am very much proactive in where i invest my time and with whom, so i like posting here what i know and what i have learnt. A sensible word/ sentence which has meaning and not speculations.
Thank you all,
Gaurav
Really like the color scheme of your glances. ![]() Mine looks nothing like that.
Mine looks nothing like that.


