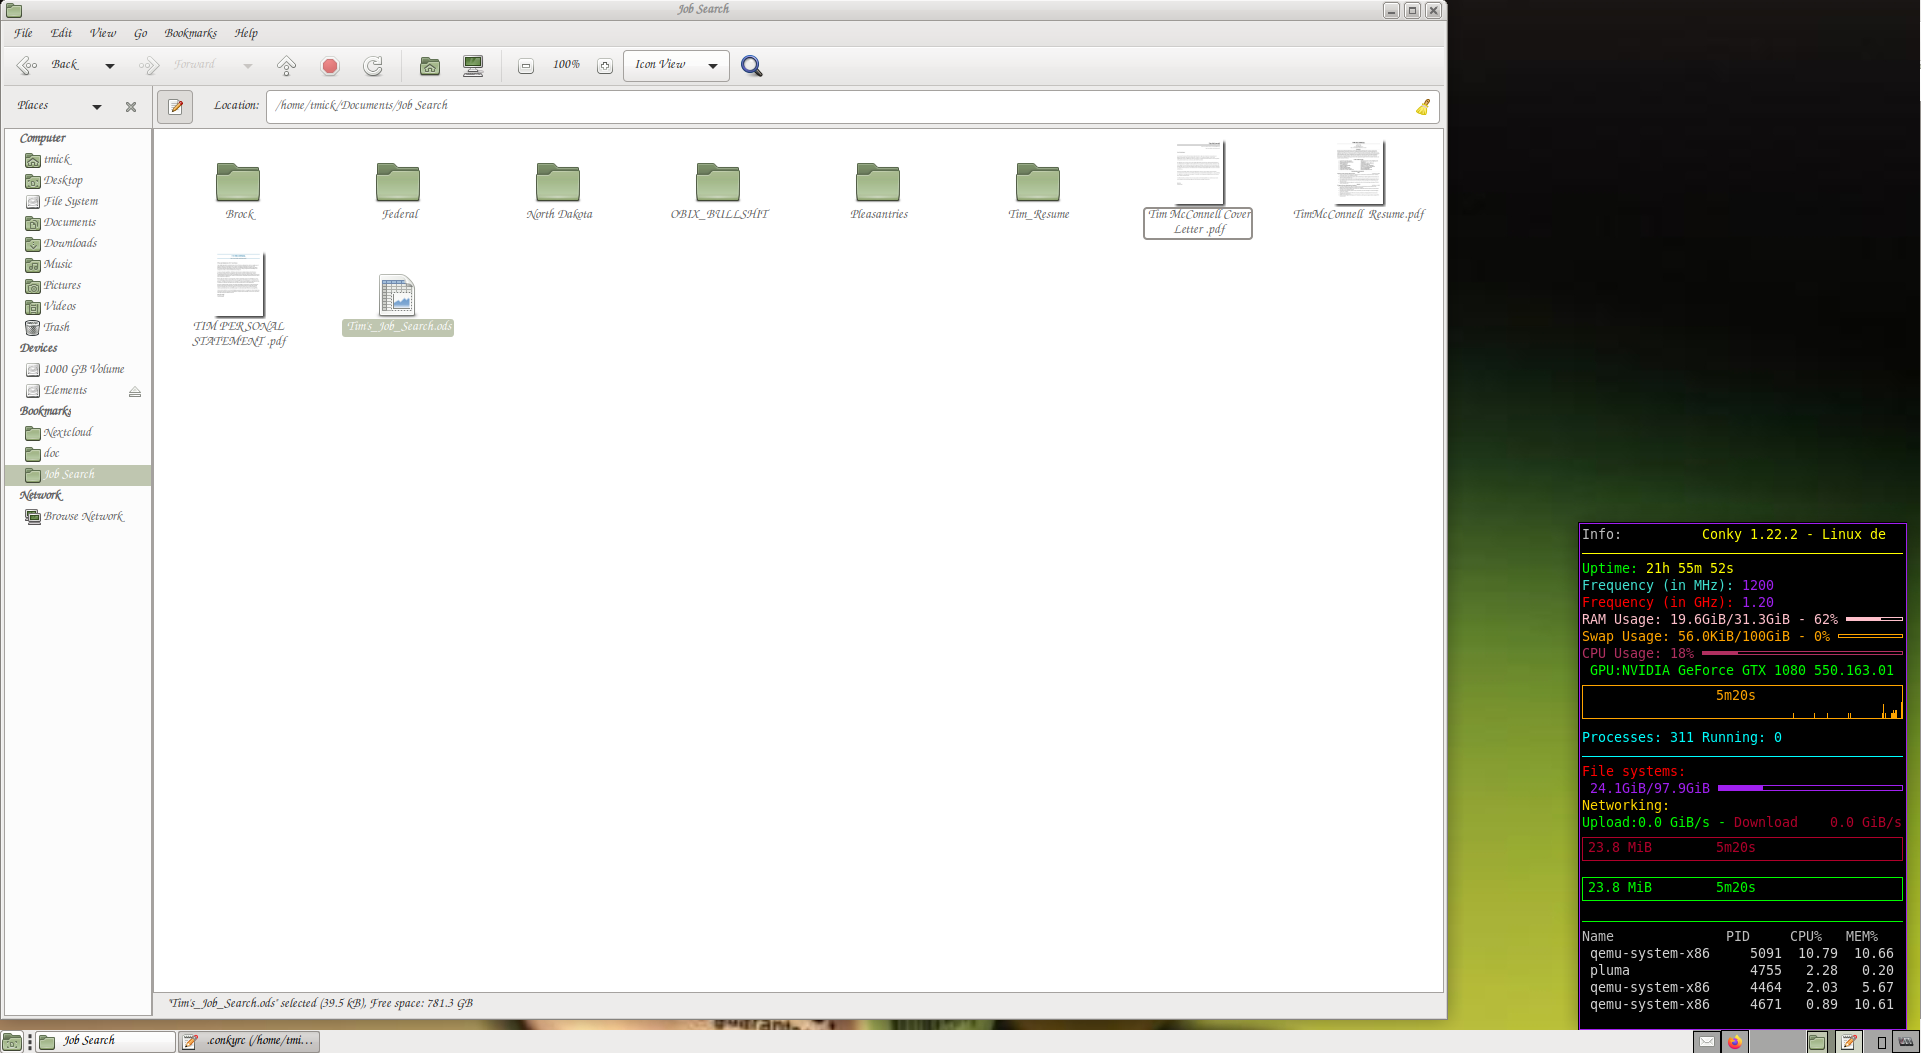
For anyone that cares, I finally figured out Conky is reading the bridge not the actual GPU’s. I wound up taking the code out for GPU1 altogether and the code for the utilization, temp, and performance for GPU0 as well, so now it just has the graph that monitors GPU0.
It now looks like
this:
and the code looks like this:
– Configuration settings: Conky – Config settings
conky.config = {
    alignment = 'bottom_right',
    background = false,
    border_width = 1,
    cpu_avg_samples = 2,
    default_color = 'purple',
    default_outline_color = 'green',
    default_shade_color = 'white',
    double_buffer = true,
    draw_borders = true,
    draw_graph_borders = true,
    draw_outline = false,
    draw_shades = false,
    extra_newline = true,
    font = 'DejaVu Sans Mono:size=12',
    gap_x = 20,
    gap_y = 20,
    minimum_height = 600,
    minimum_width = 100,
    net_avg_samples = 2,
    no_buffers = true,
    out_to_console = false,
    out_to_ncurses = false,
    out_to_stderr = false,
    out_to_wayland = false,
    out_to_x = true,
    own_window = true,
    own_window_class = 'Conky',
    own_window_type = 'normal',
    own_window_hints = 'undecorated,sticky,below,skip_taskbar,skip_pager',
    show_graph_range = true,
    show_graph_scale = true,
    stippled_borders = 0,
    update_interval = 1.0,
    uppercase = false,
    use_spacer = 'none',
    use_xft = true,
       }
– Variables: Conky – Variables
conky.text = [[
${color grey}Info:${color yellow} ${scroll 32 Conky $conky_version - $sysname $nodename $kernel $machine}
$hr
${color green}Uptime:${color yellow} $uptime
${color turquoise}Frequency (in MHz):$color $freq
${color red}Frequency (in GHz):$color $freq_g
${color pink}RAM Usage:${color pink} $mem/$memmax - $memperc% ${membar 4}
${color orange}Swap Usage:${color orange} $swap/$swapmax - $swapperc% ${swapbar 4}
${color maroon}CPU Usage:${color maroon} $cpu% ${cpubar 4}
${color green} GPU:${nvidia modelname} ${nvidia driverversion}
${color orange}${nvidiagraph gpuutil 40,C8 -t -l -m GPU-8e59faef-cee9-258c-a5e4-0b525715b9d2 }
${color cyan}Processes:${color cyan} $processes ${color cyan}Running:${color cyan} $running_processes
$hr
${color red}File systems:
 $color${fs_used /}/${fs_size /} ${fs_bar 6 /}
${color gold}Networking:
${color 00fc00}Upload:${color 00fc00}${upspeedf enp0s31f6} GiB/s - ${color af002a}Download ${color af002a}${alignr}${downspeedf enp0s31f6} GiB/s
${color af002a}${downspeedgraph enp0s31f6 28,C8 00ff00 ffff00 -m}
${color 00fc00}${upspeedgraph enp0s31f6 28,C8 00ff00 ffff00 -m}
$hr
${color grey}Name              PID     CPU%   MEM%
${color lightgrey} ${top name 1} ${top pid 1} ${top cpu 1} ${top mem 1}
${color lightgrey} ${top name 2} ${top pid 2} ${top cpu 2} ${top mem 2}
${color lightgrey} ${top name 3} ${top pid 3} ${top cpu 3} ${top mem 3}
${color lightgrey} ${top name 4} ${top pid 4} ${top cpu 4} ${top mem 4}
]]
It’s simple but shows mostly what I wanted.